Skip to content
Sheetli
Templates › Money › Budget Command Center
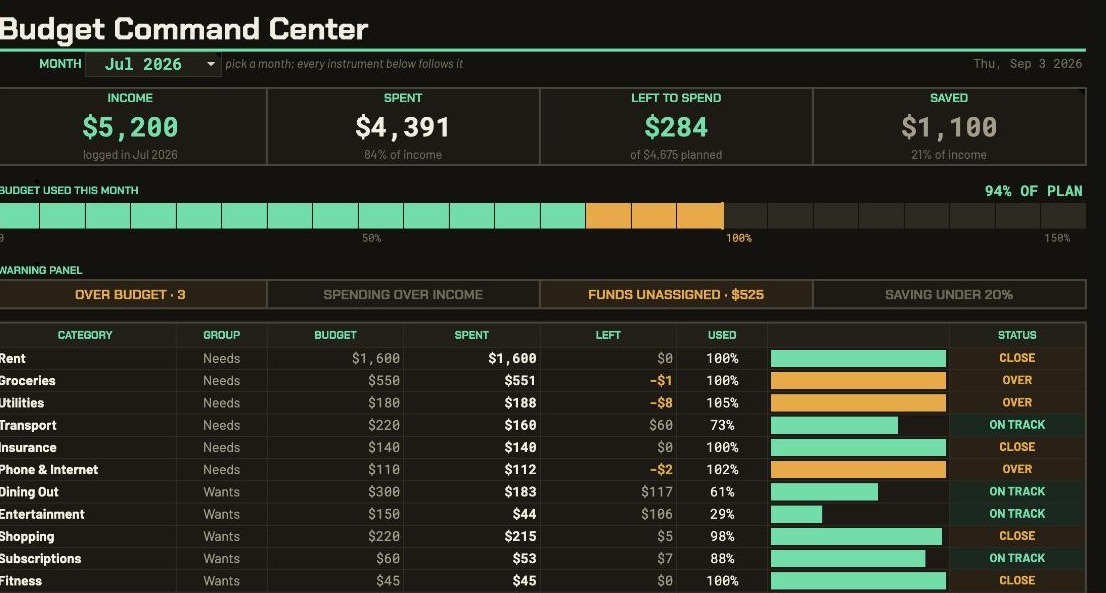
Dashboard — the console: pod readouts, a gauge with a redline at 100%, and four warning lamps

Dashboard — the console: pod readouts, a gauge with a redline at 100%, and four warning lamps

What it does

Most budget templates are a list of numbers. This one is a dashboard.

Pick a month from the dropdown at the top and the whole thing follows — what came in, what went out, what's left, and exactly which categories are quietly eating your money.

You see the problem before you go looking for it.

Every category gets a bar and a status: green when you're on track, amber when you're close to the line, red when you've gone over. No hunting through rows. You glance at the colour and you know.
The 50/30/20 check, done properly.

Needs, wants and savings are measured against your actual income for that month, not your plan — so it tells you what really happened, not what you meant to happen.

Twelve months, side by side.

Income, spending, net and savings rate for every month, filling in as you go. The month you see the pattern is the month things change.

Top spenders, ranked.

Your five biggest categories for the month, worked out automatically. It is almost never the one you'd guess.

What's inside

6 tabs

  • Dashboard — a console you read at a glance: four bezelled pod readouts, a 24-segment gauge of the month's spending against plan with an amber band and a redline at 100%, a panel of four warning lamps that stay dark until something is actually wrong, a 20-category table with colour-coded status, three level meters scoring you against 50/30/20 with each target marked, and your top five spenders
  • Set Up — categories, budgets and Needs/Wants/Savings tags; done once in ten minutes
  • Transactions — 500 rows with category and type as dropdowns, so nothing gets mistyped
  • Trends — twelve months of income, spend, net and savings rate
  • Start Here — plain-English setup
  • Sample data preloaded so you can see it working, then clear it in seconds

Why this one

Checked, not eyeballed

  • No checkboxes to add, no scripts, no permissions to grant — including on the Google Sheets mobile app
  • Every figure was tested against an independent recalculation, including the awkward cases: a month with no transactions, a category with no budget, and no income logged yet
  • Google Sheets — nothing to install, nothing to approve, and it works in the phone app
Formulas371
Evaluation errors0
Independent checks661
Bugs caught before release3

661 checks over every pod readout, category row, level meter, the top-spender ranking, all 12 trend rows, and the nine mirrored numbers the gauge and the warning lamps are lit from. Three real bugs caught by that suite before delivery — twice the same one, a month label that Google Sheets quietly read as a date.

The details

What you get
  • A thank-you page and email with your view-only Google Sheets link — open it, then File → Make a copy
  • Real checkboxes, sparklines and charts, built natively in Sheets
  • Instant delivery after payment; the link never expires
Your data stays yours
You take a copy into your own Drive. Everything you type lives in your copy. You can never edit the master, and I can never see a number in yours.
Good to know
Digital product — nothing is posted. Google Sheets only; you'll need a free Google account. Works on the Sheets mobile app. For personal use; please don't resell or redistribute the file. Something not working? Email me and I'll fix it.
Refunds
Instant digital downloads can't usually be returned once delivered — but if something doesn't work, message me before asking for a refund and I will sort it out. Full policies.

Goes well with

All templates →
Budget Command Center
$9
Coming soon